
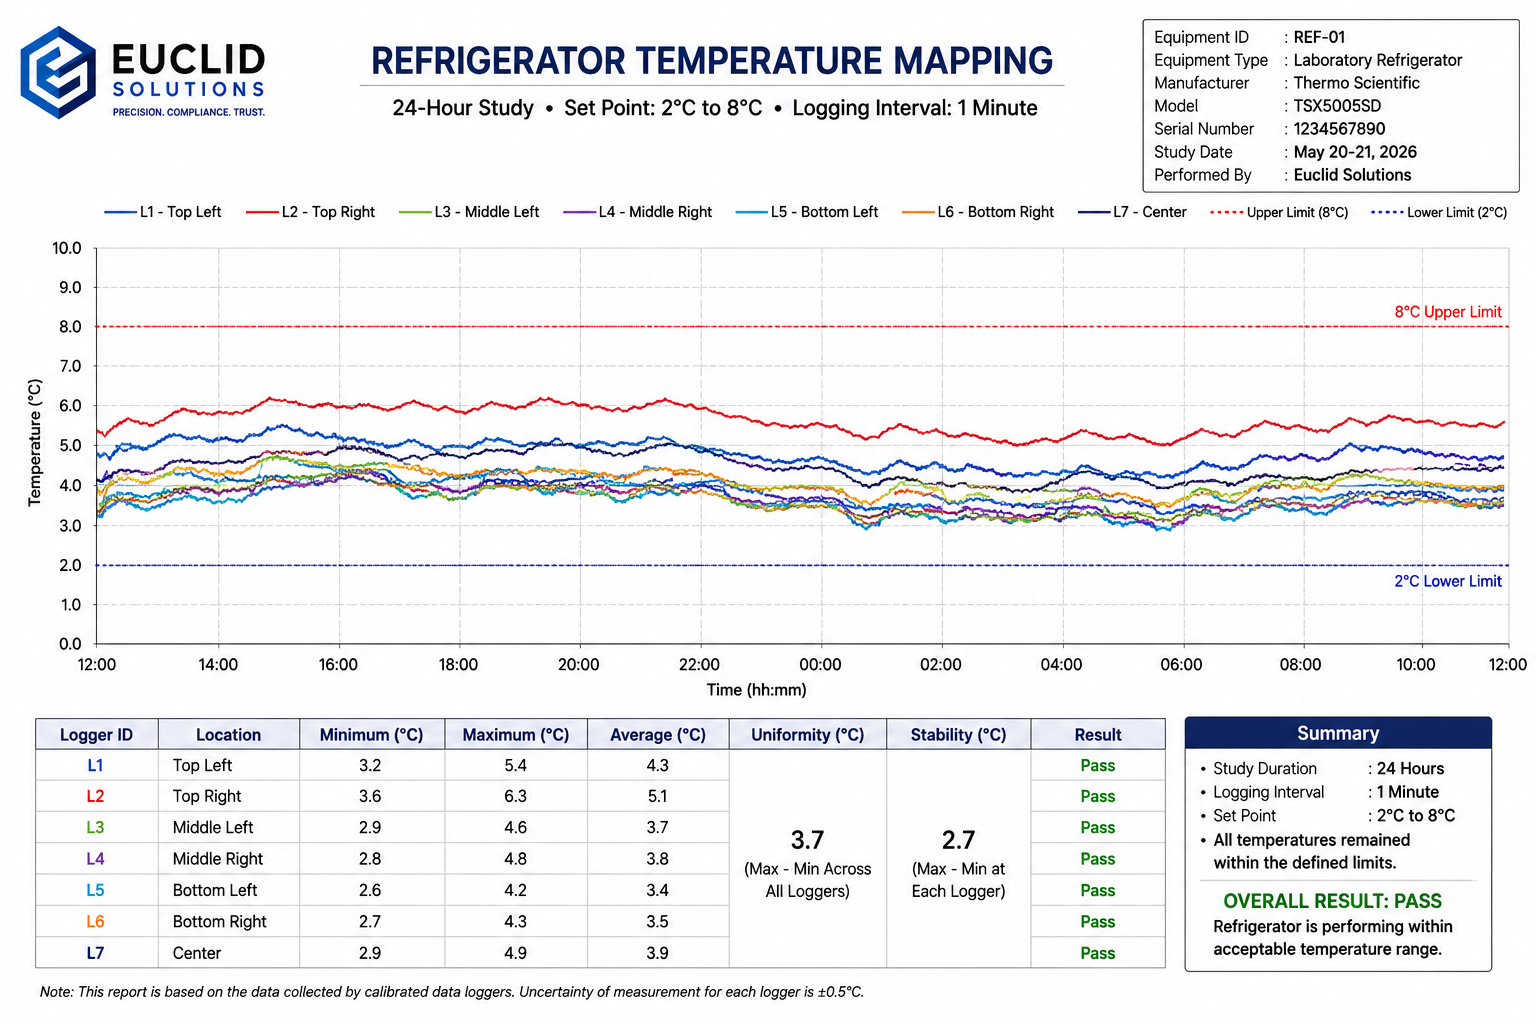
Refrigerator Temperature Mapping with Data Loggers: Ensuring Cold Chain Compliance and Product Integrity
What is Refrigerator Temperature Mapping?
Temperature mapping is the process of placing multiple calibrated temperature data loggers throughout a refrigerator to monitor temperature continuously over a defined period, typically 24, 48, or 72 hours.
The study is designed to evaluate:
- Temperature uniformity
- Temperature stability
- Hot and cold spots
- Worst-case storage locations
- Overall equipment performance
The collected data provides objective evidence that products stored inside the refrigerator remain within the specified temperature range.
Why is Temperature Mapping Important?
A refrigerator display usually measures temperature at only one location. However, different areas inside the cabinet can experience significantly different temperatures.
Temperature mapping helps organizations:
- Verify compliance with Health Canada GMP and GDP
- Qualify new refrigeration equipment
- Support IQ/OQ/PQ activities
- Demonstrate audit readiness
- Identify unsuitable storage locations
- Reduce product quality risks
- Optimize temperature monitoring sensor placement
Equipment Used
Professional refrigerator mapping studies use:
- Calibrated temperature data loggers
- NIST-traceable reference standards
- Temperature mapping software
- Logger placement diagrams
- Validated analysis methods
At Euclid Solutions, all studies are performed using calibrated temperature data loggers with documented traceability and are supported by our ISO 9001:2015 Certified Quality Management System.
Typical Temperature Mapping Procedure
1. Study Planning
A mapping protocol is prepared defining:
- Equipment identification
- Acceptance criteria
- Number of loggers
- Logger locations
- Logging interval
- Study duration
2. Logger Placement
Temperature data loggers are positioned throughout the refrigerator to represent the entire storage volume.
Typical locations include:
- Top
- Middle
- Bottom
- Front
- Rear
- Left
- Right
- Centre
Additional sensors may be installed depending on refrigerator size.
3. Continuous Monitoring
The refrigerator operates under normal conditions while temperature data are recorded automatically.
Typical settings:
- Study Duration: 24–72 hours
- Logging Interval: 1–5 minutes
Thousands of temperature readings are collected during a single study.
Technical Data Analysis
After completion of the study, recorded data are analyzed using statistical calculations to evaluate refrigerator performance.
1. Average Temperature
Average temperature indicates the mean operating temperature at a specific logger location.
Example
Recorded temperatures:
2.8°C, 3.1°C, 3.3°C, 3.0°C, 3.2°C
2. Temperature Uniformity
Temperature uniformity evaluates the difference between the warmest and coldest measured locations.
Example
Highest Logger:
6.7°C
Lowest Logger:
3.1°C
Smaller values indicate better temperature distribution throughout the refrigerator.
3. Temperature Stability
Temperature stability measures the variation of temperature at one location during the monitoring period.
Example
Maximum:
5.8°C
Minimum:
3.9°C
Lower stability values indicate more consistent performance.
4. Compliance Assessment
For pharmaceutical refrigerators operating between 2°C and 8°C, every recorded temperature should remain within the specified operating range.
| Logger | Minimum | Maximum | Result |
|---|---|---|---|
| Logger 1 | 3.1°C | 6.5°C | Pass |
| Logger 2 | 2.8°C | 7.1°C | Pass |
| Logger 3 | 1.8°C | 6.9°C | Fail |
| Logger 4 | 3.3°C | 8.2°C | Fail |
Any excursion outside the acceptable range should be investigated to determine the root cause and assess potential product impact.
5. Measurement Uncertainty
Measurement uncertainty provides confidence in the reported results.
Example:
Measured temperature:
7.8°C
Expanded uncertainty:
±0.5°C
Potential upper value:
Considering uncertainty is particularly important when measured temperatures are close to specification limits.
Typical Deliverables
A professional temperature mapping report generally includes:
- Study protocol
- Equipment identification
- Calibration status of data loggers
- Logger placement diagram
- Temperature graphs
- Statistical summaries
- Minimum, maximum and average temperatures
- Uniformity calculations
- Stability calculations
- Hot and cold spot identification
- Conclusions
- Recommendations
These reports provide documented evidence suitable for quality audits and regulatory inspections.
When Should Temperature Mapping Be Performed?
Temperature mapping is recommended:
- Before equipment is placed into service
- During Operational Qualification (OQ)
- After relocation
- Following major repairs
- After refrigeration system modifications
- Following significant maintenance
- During periodic requalification
- When storage requirements change
Why Choose Euclid Solutions?
Euclid Solutions provides professional temperature mapping and validation services using calibrated temperature data loggers and documented procedures aligned with industry best practices.
Our services include:
- Refrigerator Temperature Mapping
- Cold Room Validation
- Freezer Temperature Mapping
- Stability Chamber Validation
- Warehouse Temperature Mapping
- Incubator & Oven Validation
- Data Logger Deployment
- Audit-Ready Validation Reports
Our Advantages
- ✔ ISO 9001:2015 Certified Quality Management System
- ✔ NIST-Traceable Measurements
- ✔ Professional Validation Documentation
- ✔ On-Site Services
- ✔ Experienced Technical Team
- ✔ Serving Toronto, the GTA & Across Canada
Conclusion
Temperature mapping is more than simply recording temperatures—it is a comprehensive validation process that demonstrates whether a refrigerator consistently provides suitable storage conditions for temperature-sensitive products. By identifying hot spots, cold spots, and temperature variations, organizations can make informed decisions about product placement, monitoring locations, and equipment performance.
Whether you operate a pharmaceutical facility, hospital, diagnostic laboratory, biotechnology company, food manufacturing plant, or research institution, a professionally executed temperature mapping study helps strengthen compliance, protect valuable products, and support quality assurance.
Contact Euclid Solutions
Euclid Solutions
Calibration • Validation • Thermal Mapping Services
🌐 www.euclidsolution.net
📧 info@euclidsolution.net
Serving Toronto, the GTA & Across Canada
Precision. Compliance. Trust.